Discussion at Technical Session No. 9—Rock Mechanics

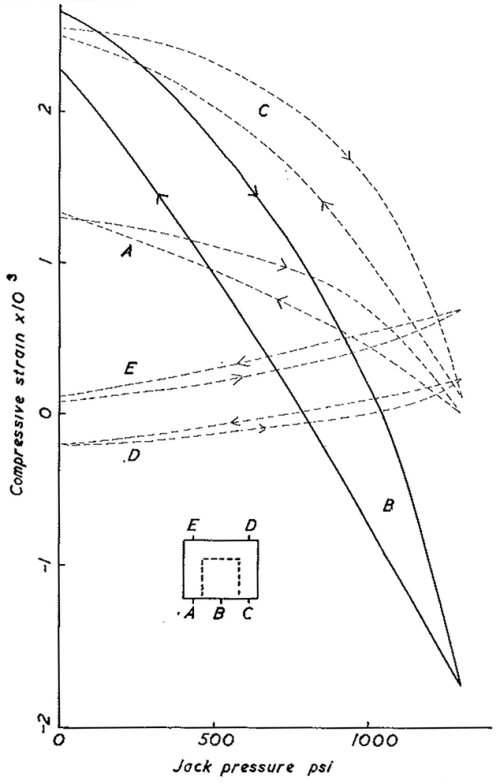
Fig. 9d—Strain in a Faulty Concrete Block under Conditions Similar to Fig. 9c. The load stress is 490 p.s.i. Behaviour at the five individual measuring points is shown
It is suggested that for sound rock, uniformly stressed, the flat jack method gives a reliable indication of stress. On the other hand, in unsound rock it may not do so. The concrete blocks used by the writer were not satisfactorily cured and one of them apparently had an internal flaw between the measuring points C running towards the jack which ultimately appeared as a surface crack.
The effect of this may be seen from the cycling experiment at 490 p.s.i. load pressure shown in Fig. 9d; the displacement between the measuring points C is very great and the points D actually move apart. In these circumstances the present experiment shows the type of behaviour of the rock very clearly, but it is extremely difficult to use it as a measurement of load pressure. Curve II of Fig. 9b shows the jack pressure necessary to make the displacement at B across the jack equal to the average displacement at A, C, D, E. It is seen to be 30 per cent too high. As a second example of the effect of unsoundness, Curves III, IV, V of Fig. 9b were obtained on a concrete block which had a vertical crack intersecting the jack. Curve III was obtained after the crack had opened, Curve IV a month later after some creep had occurred, and Curve V with the block restrained laterally, by external bolts parallel to the jack. In all cases relatively high jack pressures are measured. These observations have no counterpart in the method of using flat jacks underground. They do suggest, however, that anomalous results may be obtained in unsound rock and it must be emphasized that all these anomalous results are consistent and reproducible so that if only one or two pairs of measuring pins are used there might be little indication that they were in fact anomalous.
In the same way the present method allows the effects of non-uniform loading of a rock to be assessed experimentally. In a number of experiments the rock was stressed (symmetrically) over only half of its upper surface and the jack pressure compared with the average load over the whole surface. Curves of jack pressure against load pressure measured as in Fig. 9b ranged from 30 per cent too high when the load was applied in the centre region covering the jack to 30 per cent too low when the load was applied over the outer region away from the jack.
